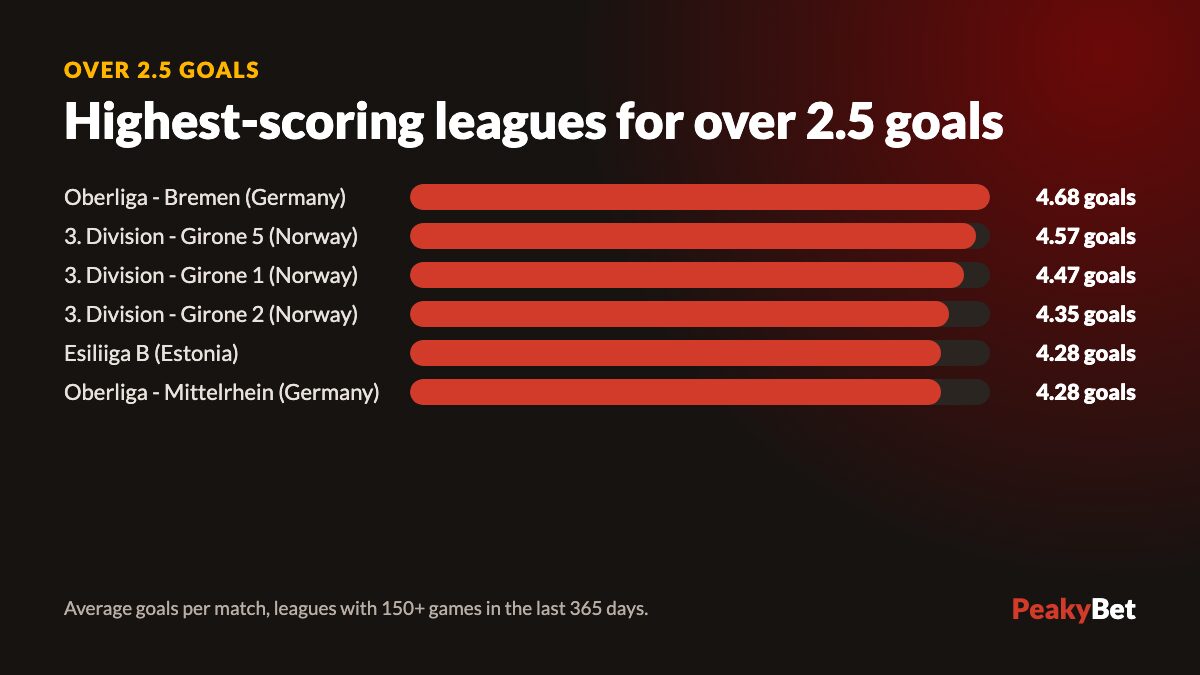
The highest-scoring leagues in PeakyBet’s supplied group include Oberliga - Bremen, with 4.68 goals per match and an 83% over 2.5 rate. Across all recorded matches, the over 2.5 rate is 56%. Use league figures to find fixtures worth studying, then check the teams and price before making a goals selection.
Read the high-goal group with its sample sizes
These tables use completed matches from the last 365 days in PeakyBet’s dataset. The supplied groups sit within a set of 291 ranked leagues and competitions. Entries are shown in the supplied order. The average-goals column is not a strict descending ranking, so read the figures rather than assuming each row has fewer goals than the row above.
| League or competition | Country | Matches | Average goals | Over 2.5 |
|---|---|---|---|---|
| Oberliga - Bremen | Germany | 171 | 4.68 | 83% |
| 3. Division - Girone 5 | Norway | 168 | 4.57 | 83% |
| 3. Division - Girone 1 | Norway | 167 | 4.47 | 81% |
| Esiliiga B | Estonia | 157 | 4.28 | 80% |
| Oberliga - Mittelrhein | Germany | 156 | 4.28 | 79% |
| 3. Division - Girone 2 | Norway | 164 | 4.35 | 78% |
| FA Trophy | England | 189 | 3.66 | 77% |
| Oberliga - Schleswig-Holstein | Germany | 190 | 3.99 | 77% |
| Oberliga - Hamburg | Germany | 216 | 4.19 | 77% |
| 3. Division - Girone 3 | Norway | 164 | 4.24 | 77% |
A high over 2.5 rate means that the goals line was passed often in the recorded sample. It does not mean that every club in the group plays the same way. The match count also matters: these are observed results from the listed fixtures, not a permanent rule for the competition.
Compare the lower-goal group before drawing conclusions
The lower-goal group offers a different starting point. Azadegan League averages 1.70 goals and has an over 2.5 rate of 23%. That is a very different recorded background from Oberliga - Bremen. Use the contrast to question your initial expectation, while remembering that the individual fixture can still differ from its league.
| League or competition | Country | Matches | Average goals | Over 2.5 |
|---|---|---|---|---|
| Azadegan League | Iran | 171 | 1.70 | 23% |
| Premier League | Ethiopia | 210 | 1.78 | 26% |
| Primera C | Argentina | 436 | 1.92 | 28% |
| Premier Soccer League | Zimbabwe | 266 | 1.88 | 31% |
| Girabola | Angola | 160 | 2.01 | 31% |
| Torneo Federal A | Argentina | 476 | 1.93 | 31% |
| Premier Soccer League | South-Africa | 171 | 2.18 | 32% |
| Botola 2 | Morocco | 151 | 2.07 | 32% |
| Primera B Metropolitana | Argentina | 410 | 1.98 | 32% |
| Liga Pro Serie B | Ecuador | 166 | 1.95 | 34% |
A lower rate is not an instruction to back under in every match. A strong attack facing a weak defence may create a different picture. Likewise, unfamiliar competition names do not make a selection better value. If you cannot assess the teams with enough confidence, passing is a reasonable response to the missing context.
Separate average goals from the over 2.5 rate
The all-match data shows an average of 2.98 goals and an over 2.5 rate of 56%. These measures answer different questions. The average describes the overall amount of scoring. The rate describes how often a particular goals line was passed. A few very high totals can influence an average without making every match high scoring.
For an over 2.5 selection, pay close attention to the relevant rate, then examine the teams. Do not choose the league with the largest average and assume the task is finished. The league figure is a broad filter. The actual bet concerns a specific fixture at a specific price, with its own reasons for being open or tight.
Build a match shortlist from the league context
Choose a fixture from a competition you can assess, then compare the home and away scoring picture. Look at both goals scored and the goals allowed by the opponents. A good attack alone may not tell the full story if it faces a strong defence. Keep the latest results in context rather than relying on the most dramatic recent score.
The over and under 2.5 goals predictions can support that review. PeakyBet uses Poisson expected goals from season averages and the latest 5 matches, blended 50/50 with bookmaker odds after removing the margin. The output remains an estimate. It cannot turn a favourable league background into certainty for a particular game.
Check whether your idea needs both teams to score
Over 2.5 goals and both teams to score are separate markets. A dominant side can supply enough goals for an over selection without conceding. A match can also have both teams on the scoresheet without passing the over 2.5 line. Decide which condition matches your reasoning before comparing the available prices.
Use the both teams to score predictions when your view depends on attacking chances for each team. Do not move between markets merely to find a bigger payout. Changing the market changes what must happen, so the evidence supporting the selection needs to change with it.
Price and budget still decide whether to play
A league’s scoring reputation may already be reflected in the odds. Frequent goals do not automatically mean an attractive price for over selections. Write down your reason for the match choice, then decide whether the return suits the uncertainty. If the selection only appeals because of a league table, more match research may be needed.
Betting is for adults aged 18+ only. Stake only money you can afford to lose. Keep your limit separate from essential spending and stop if you feel pressure to chase losses. A useful data table helps you understand a market; it does not create an obligation to place a bet.
Frequently asked questions
Are the tables a list of today’s available betting markets?
No. They describe historical competition data. A listed competition may not have a suitable fixture or available market when you look, so check the actual match options separately.
Does a larger match sample remove uncertainty?
No. More recorded matches can provide broader context, but the next fixture still has its own teams and conditions. A larger sample does not make an individual result certain.
Should I compare league figures from different time windows?
Only with care. Different periods may include different teams and schedules. Keep the coverage clear when comparing figures, so a change in the sample is not mistaken for a new trend.